P2P Lending Industry Risk Analysis Platform
The goal of this project is to perform risk analysis for the P2P Internet finance industry, establish standardized risk assessment dimensions and risk assessment models, identify high-risk P2P Internet finance enterprises, and ultimately generate automated risk analysis reports for P2P Internet finance enterprises.
This project selected over 800 representative enterprises in the P2P Internet finance industry. Based on massive historical data from multiple aspects and dimensions of these enterprises, appropriate risk assessment dimensions were chosen and risk assessment models were built to analyze the risks currently faced by these P2P Internet finance enterprises. The overall risk profile and risk profiles across different domains of each enterprise were evaluated, and risk reports for P2P Internet finance enterprises were generated, providing an intuitive and accurate display of risk data, risk indicators, and risk ratings across all aspects of the enterprises. This meets the regulatory needs of Internet finance supervision and facilitates risk monitoring of Internet finance enterprises.
Technical Roadmap
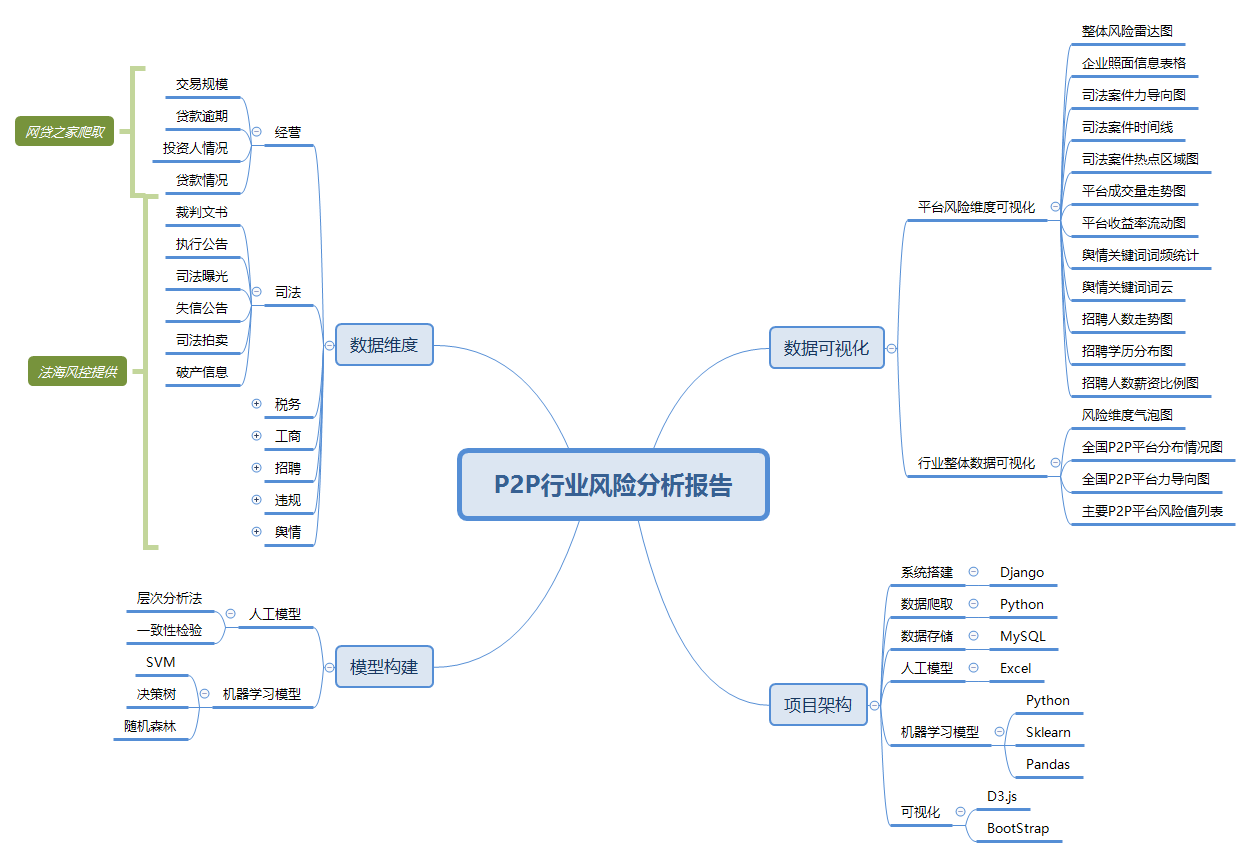
Data Dimensions
The judicial dimension information was collected (including court judgments, execution announcements, judicial exposure, dishonesty announcements, judicial auctions, and bankruptcy information), along with tax dimension information, industry and commerce dimension information, recruitment dimension information, violation dimension information, public opinion dimension information, and business dimension information crawled from Wangdaizhijia (including transaction scale, loan defaults, investor conditions, loan conditions, etc.). After acquiring this information, the unformatted data was stored into a structured MySQL database through data cleaning, conversion (into unified CSV format), and integration.
Model Construction
For the business dimension data with relatively complete records, machine learning models were constructed. To make prediction results more accurate, SVM models, decision tree models, random forest models, and LightGBM models were selected to train and test the data, and the model with the best prediction performance was selected for use. For non-business dimension indicators with strong domain knowledge relevance, fewer data records, and more discretized data, the Analytic Hierarchy Process (AHP) and consistency testing methods were adopted to build models manually. Finally, the two models (manual models and machine learning models) were cross-validated to ensure the correctness of the models.
Project Architecture
The overall project architecture includes the initial data crawling, data cleaning, data storage, and other data-related processing workflows, followed by the construction of model layers such as manual models and machine learning models, and finally the presentation of results in the form of a visualization website.
Data Visualization
Data visualization uses D3.js technology to present visualization effects through data transmitted from the Django backend. The presentation mainly includes two aspects:
The first is visualization of overall P2P industry data, including Risk Dimension Bubble Charts, National P2P Platform Distribution Maps, National P2P Platform Force-Directed Guide Maps, and Major P2P Platform Risk Value Lists.
The second is visualization of risk dimensions for specific platforms, including Overall Risk Radar Charts, Enterprise Profile Information Tables, Judicial Case Force-Directed Maps, Judicial Case Timelines, Judicial Case Hotspot Region Maps, Platform Transaction Volume Trend Charts, Platform Yield Rate Flow Maps, Public Opinion Keyword Frequency Statistics, Public Opinion Keyword Word Clouds, Recruitment Number Trend Charts, Recruitment Education Distribution Maps, and Recruitment Number-to-Salary Ratio Charts, among others.
Risk Point Identification
Risk Dimensions and Descriptions
| Dimension | Sub-dimension | Description |
|---|---|---|
| Litigation Information | Bankruptcy information, judicial auctions, dishonesty announcements, judicial exposure platform, execution announcements, court judgments | Litigation information, i.e., judicial information, describes information about legal cases involving the enterprise, the enterprise's illegal activities, information about the enterprise being sued, and information about judicial auctions and bankruptcy involving the enterprise. Whether an enterprise operates in accordance with the law and whether it has illegal activities can largely reflect the enterprise's risk situation. Legal and compliant enterprise behavior is a necessary condition for stable enterprise development, whereas excessive litigation and serious illegal activities indicate that the enterprise has too many problems and that the enterprise risk is too high. |
| Industry & Commerce Information | Serious violations, administrative penalty information by industry and commerce authorities, abnormal operations, affiliated information, change information, industry and commerce public disclosure information, enterprise public disclosure information | (1) Industry and commerce information describes basic industry and commerce information such as the enterprise's capital, legal representative, and business scope. As important information describing the enterprise, abnormal changes and significant modifications in industry and commerce information indicate that anomalies exist in the enterprise and that higher risks may arise. (2) In addition, the project focuses on risk information of affiliated parties. Affiliated information describes other enterprises related to the enterprise, including outbound investments by the enterprise and the legal representative, subsidiaries, etc. Change information describes changes in industry and commerce information. Anomalous changes or significant changes imply the emergence of risk. |
| Tax Information | Abnormal taxpayers, administrative penalties, tax arrears announcements, tax credit ratings (ABCD) | Tax information describes whether the enterprise files and pays taxes on time, exposes tax evasion and tax arrears behavior by enterprises, and to some extent reflects problems with enterprise credit. Long-term tax arrears or being classified as an abnormal taxpayer by tax authorities indicate that the enterprise has violated laws and regulations, its operations are abnormal, and financial or funding problems may have arisen, indicating significant enterprise risk. |
| Business Information | Loan default conditions, transaction scale | Business data is extracted from Wangdaizhijia, Wangdaitianyan, and the Internet Finance Level Disclosure Service Platform. It evaluates the transaction scale and loan default conditions of P2P lending platforms through quantitative indicators. |
| Public Opinion Information | News media | By crawling information related to P2P lending platforms from WeChat, Weibo, and news apps, the analysis examines whether news articles contain keywords such as "fraud, withdrawal difficulties, defaults, inaccessible, yield, interest rate, cash coupons, interest rate hikes, regulation, custodiary, terrible, speechless, opaque, falsification, self-financing, exposure, cannot connect, cannot open, frequent changes" and other fields to determine the severity of news events. |
| Violation Information | ICP certification, bank custody, central bank penalties, CBRC penalties | (1) ICP certification is a mandatory license for all Internet business operations. If a P2P platform has no ICP certification record, it can be determined to be operating illegally. (2) The "Guidelines for Network Loan Fund Custody Business" issued in August 2016 requires all P2P platforms to complete bank custody. Bank custody separates the P2P enterprise's own fund accounts from user funds, achieving separation of funds and transactions and preventing direct misappropriation of user funds. If a platform has no bank custody record, higher risk may arise. |
| Recruitment Information | Management education level, recruitment education distribution, number of positions and number of recruits | The project analyzes the education distribution of the platform team through recruitment information published by the platform, especially the education distribution of management. If there is a large number of barrier-free recruitments in a short period or serious vacancies in management positions, it indicates that the platform may be at risk. |
Project Credit Risk Rating Indicator System
Analytic Hierarchy Process — specific indicators omitted.
System Setup
- D3.js (frontend visualization)
- Python + Django (backend request handling)
- MySQL (backend database)
- Access port: 8000
Data Extraction and Processing
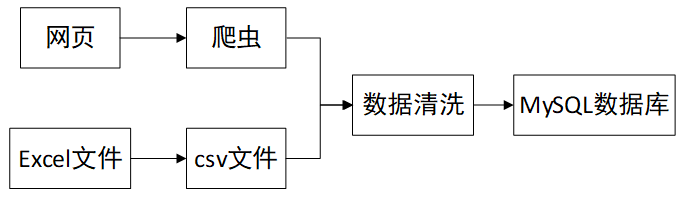
There are two main data sources for this project: one is the business information of P2P platforms crawled from web pages, and the other is industry and commerce information and other data provided by the enterprises. This section describes how to extract data through crawlers and how to process the data provided by enterprises, forming structured data stored in a MySQL database after the data cleaning process.
Data Extraction via Crawlers
Scrapy Framework
Scrapy is a fast, high-level web crawling framework developed based on the Python language, used to crawl websites and extract structured data from pages. Scrapy has a wide range of uses and can be employed for data mining, monitoring, and automated testing.
Main Data Sources
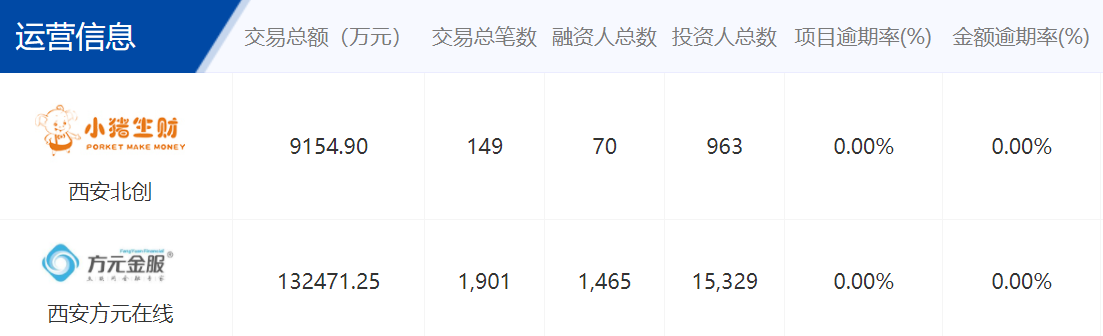
The data comes from major P2P platform websites. Taking business data as an example, the platform transaction data from Wangdaizhijia and the operational information from the Internet Finance Registration and Disclosure Service Platform of the China Internet Finance Association were selected as sources of business information. From these websites, information such as total transaction amount, total number of transactions, total number of financiers, total number of investors, project default rate, and amount default rate of P2P platforms can be obtained as targets for data crawling.

Data Acquisition
Since the operational information on the Internet Finance Registration and Disclosure Service Platform of the China Internet Finance Association is dynamically loaded on the web page, the corresponding data can be obtained from the numbers within the corresponding tags in the web page source code. For example, the following figure shows the process from displaying platform transaction volume on the web page to obtaining the specific numerical value of the transaction volume:

Some regular expressions were still used to extract data from table tags, for example, the following figure shows the process of regular expression matching of numbers:

For the platform transaction data from Wangdaizhijia, by examining the JavaScript code of the web page, the JSON request interface of the page was found. Then Python and the Scrapy framework were used to simulate form POST requests for data to obtain business information of P2P platforms across different time periods:

Database Storage of Crawler Data
The project uses a MySQL database to store data. Since the data formats of the two disclosure platforms differ, corresponding table structures need to be established to store the platform transaction data from Wangdaizhijia and the operational information from the Internet Finance Registration and Disclosure Service Platform of the China Internet Finance Association, respectively. The established data tables are as follows:
| Column Name | Meaning |
|---|---|
| bussinessInfo | Business data disclosed by the Internet Finance Association |
| platform_name | Platform name |
| end_time | Information cutoff date |
| trade_amount | Total transaction amount (10,000 CNY) |
| trade_total_number | Total number of transactions (transactions) |
| invest_total_number | Total number of investments (transactions) |
| financiers_number | Total number of financiers (people) |
| invester_number | Total number of investors (people) |
| repaid_amount | Amount to be repaid (10,000 CNY) |
| past_amount | Default amount (10,000 CNY) |
| project_past_rate | Project default rate (%) |
| amount_past_rate | Amount default rate (%) |
| project_past_number | Number of defaulted projects |
| average_financialer_amount | Average cumulative financing per person (10,000 CNY) |
| average_invest_amount | Average cumulative investment per person (10,000 CNY) |
| average_finacing_amount | Average financing amount per transaction (10,000 CNY) |
| top1_finacing_rate | Largest single-financier financing balance proportion (%) |
| top10_finacing_rate | Largest 10-financier financing balance proportion (%) |
| top1_invest_rate | Largest single-investor investment balance proportion (%) |
| top10_invest_rate | Largest 10-investor investment balance proportion (%) |
| project_past90_rate | Tiered project default rate (90 days) (%) |
| project_past180_rate | Tiered project default rate (91-180 days) (%) |
| project_past181_rate | Tiered project default rate (181+ days) (%) |
| amount_past90_rate | Tiered amount default rate (90 days) (%) |
| amount_past180_rate | Tiered amount default rate (91-180 days) (%) |
| amount_past181_rate | Tiered amount default rate (181+ days) (%) |
| history_project_past_amount | Historical project default amount (10,000 CNY) |
| history_project_past_rate | Historical project default rate (%) |
| total_past_amount | Total cumulative default-compensation amount (10,000 CNY) |
| total_past_number | Total cumulative default-compensation count (transactions) |
| bussinessInfoId | Unique transaction information identifier ID |
| Column Name | Meaning |
|---|---|
| wdzjInfo | Published business data from Wangdaizhijia |
| wdzjInfoId | Unique transaction information identifier ID |
| platform_name | Platform name |
| amount | Transaction volume (10,000 CNY) |
| incomeRate | Average reference yield (%) |
| loanPeriod | Average loan term (months) |
| regCapital | Registered capital |
| fullloanTime | Time to fully fund (minutes) |
| stayStillOfTotal | Outstanding balance (10,000 CNY) |
| netInflowOfThirty | Net capital inflow (10,000 CNY) |
| timeOperation | Operating time |
| bidderNum | Number of investors |
| borrowerNum | Number of borrowers |
| totalLoanNum | Number of loan listings |
| top10DueInProportion | Top 10 big investors' outstanding balance proportion |
| avgBidMoney | Per capita investment amount |
| top10StayStillProportion | Top 10 borrowers' outstanding balance proportion |
| avgBorrowMoney | Per capita borrowing amount |
| developZhishu | Development index ranking |
| currentLeverageAmount | Leveraged amount |
| startDate | Start date |
| endDate | End date |
| weightedAmount | Weighted amount |
| background | Background |
| newbackground | New background |
Processing Enterprise-Provided Data
The cooperating enterprises provided data across 6 dimensions: judicial, tax, industry and commerce, public opinion, violations, and recruitment. The specific data delivery format is Excel spreadsheet files, so conversion to CSV file format is required for subsequent processing. CSV files are comma-separated text. Here, Python is used to read CSV files, split each line of text by commas, and import it into the MySQL database.
Database Table Structure
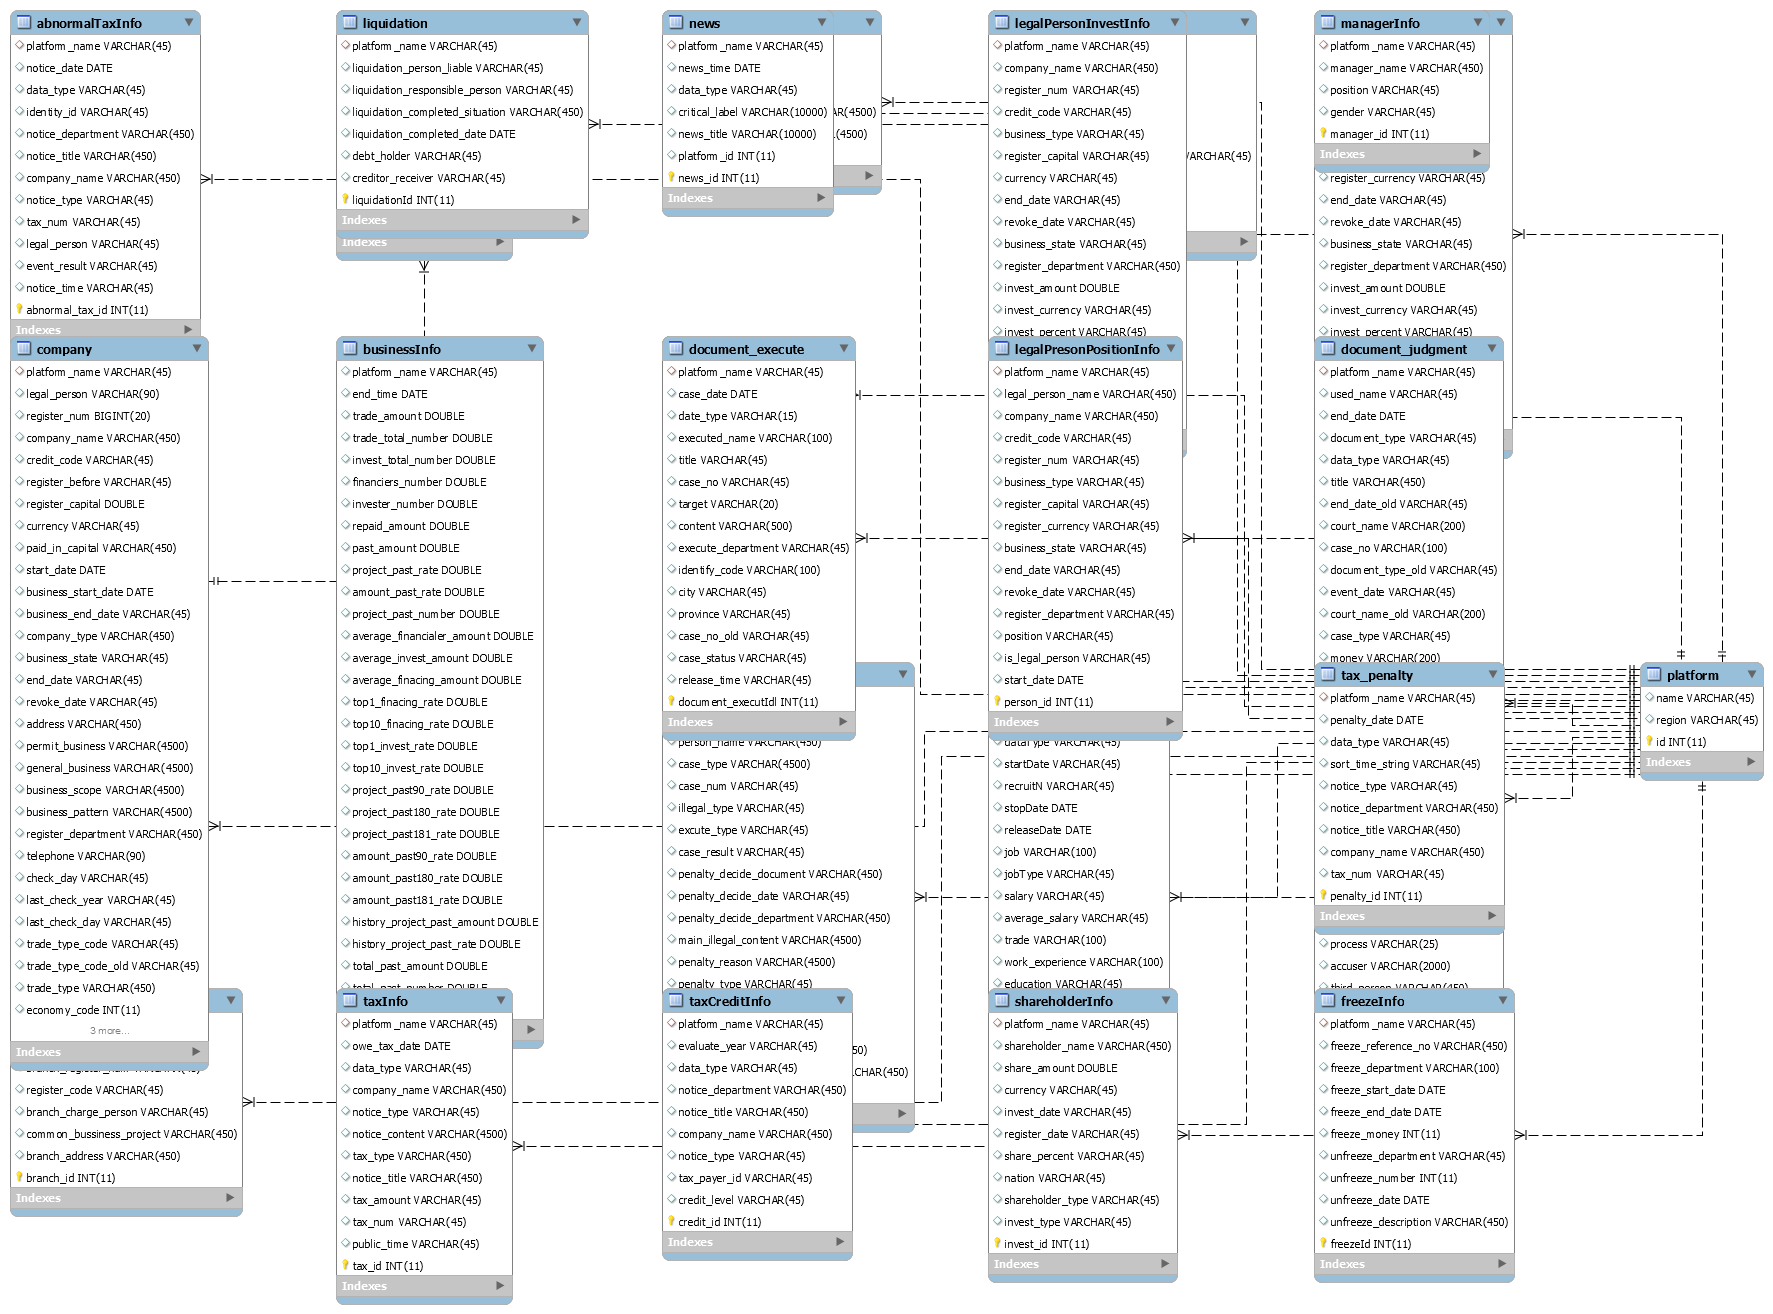
- The platform table stores the basic names and city information of P2P lending platforms. The platform name in this table is the foreign key linking all other tables. The company table stores specific industry and commerce information of subsidiaries under each platform, including the company name, registered capital, registrant, address, and other basic company information.
- Judicial dimension: The documentJudgment table and documentExecute table store court judgment information and execution announcement information in the judicial information of the corresponding platform, respectively.
- Industry and commerce information dimension: The company table, freezeInfo table, liquidation table, administrationPenalty table, shareholderInfo table, managerInfo table, legalPersonInvestInfo table, legalPersonPositionInfo table, changeInfo table, businessInvestInfo table, branchInfo table, and equityPledged table store the basic enterprise profile information, equity freezing history information, liquidation information, administrative penalty history information, shareholder and contributor information, key management personnel information, legal representative positions in other enterprises, change information, enterprise outbound investments, branch information, and equity pledge history information in the industry and commerce information of the corresponding platform, respectively.
- Tax information dimension: The taxInfo table, taxPenalty table, abnormalTaxInfo table, and taxCreditInfo table store tax arrears information, tax penalty information, abnormal tax taxpayer information, and enterprise tax credit information in the tax information of the corresponding platform, respectively.
- Public opinion information dimension: The news table stores news and public opinion information for each platform, including the type of news, important tags, news titles, and detailed public opinion content.
- Recruitment information dimension: The employInfo table stores recruitment information for each platform over each period, including position requirements, salary, benefits, location, and other basic recruitment information.
- Business information dimension: The businessInfo table and wdzjInfo table store the business information of the corresponding platform, including basic information such as transaction volume, per capita investment amount, and total investment.
- Violation information dimension: The ICP table and bankDepository table store ICP violation information and bank custody information for the corresponding platform enterprises, respectively.
Model Selection and Modeling
Referring to related research and historical literature, modeling methods previously adopted by scholars when calculating industry risk include multivariate factor analysis, entropy weight method, Logistic regression, BP neural networks, etc. Through analyzing the characteristics of the P2P industry, it was found that P2P enterprises mostly have characteristics such as diverse data formats, inconsistent structures, and a large number of missing values. Moreover, since risk values are subjective estimates, it is difficult to judge whether their estimates are accurate. Therefore, machine learning modeling and manual modeling were conducted separately on the data, and the results of the two were compared to mutually validate each other.
Machine Learning Modeling
Data Source and Variable Selection
The data was selected from all data of more than 800 P2P platforms from January 1, 2015, to the present. For the basic information of the platforms, a total of 8 indicators were selected based on data availability: operating days (cutoff date minus start date), transaction volume, average interest rate, number of investors, average loan term, number of borrowers, cumulative outstanding amount, and number of loan listings. For this study, the mean and coefficient of variation (standard deviation divided by mean) of each indicator for each platform during the data period were calculated, totaling 16 variables to represent the transaction characteristics of the platform. The mean represents the level value of each indicator, and the coefficient of variation represents the magnitude of volatility.
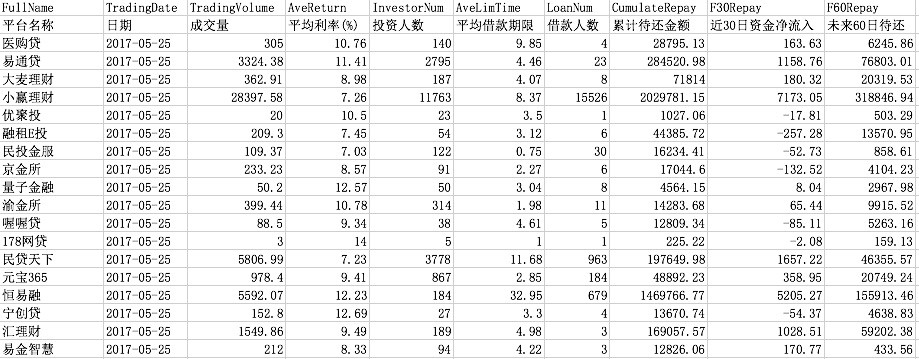
Problematic platforms (withdrawal difficulties, running away, or business suspension) crawled from Wangdaizhijia were labeled as 1, and normal platforms were labeled as 0 for prediction.

Machine Learning Models
The data was classified into two categories: normal platforms and problematic platforms, thereby transforming the risk-reward problem into a binary classification problem. After filtering, a total of 352 enterprise datasets met the requirements, of which 58 were problematic enterprises. There is a serious mismatch between the number of normal enterprise datasets and problematic enterprise datasets. To address this issue, the SMOTE method was adopted to over-sample the minority class to achieve balance between the two types of data.
This study selected three statistical models (random forest, decision tree, and SVM) to conduct the research. By comparing the results of different models, the stability and reliability of risk identification and prediction were evaluated, and a suitable prediction model was determined. The information provided by each model was comprehensively considered to analyze the risk characteristics of P2P platforms. Five-fold cross-validation was performed on the 3 machine learning models.
Result Analysis
| Model | AUC |
|---|---|
| Random Forest | 0.9333 |
| Decision Tree | 0.8484 |
| SVM | 0.9393 |
The SVM method achieved the highest test set accuracy, reaching 94% accuracy. The random forest accuracy was next, also reaching 93% test set accuracy. Compared with the random forest and SVM models, the decision tree's accuracy was less ideal, at only 85%.
In further later analysis, attempts were made to add judicial, tax, industry and commerce, and other dimensional information on top of the business dimension, but the accuracy was not very high. The analysis yielded the following reasons:
- The data is text-based and discrete in nature, making data analysis difficult;
- The data is unevenly distributed over time;
- The data distribution across platforms is uneven, especially for some platforms where data is severely missing.
Although business data predictions achieved high accuracy, most business data is published by Wangdaizhijia rather than official platforms, so its data credibility is far lower than data disclosed by official platforms such as judicial and tax authorities. To address this issue, manual model construction was carried out.
Manual Modeling
Analytic Hierarchy Process — omitted.
Comparison of the Two Modeling Methods
Through analyzing the characteristics of the P2P industry, it was found that P2P enterprises mostly have characteristics such as diverse data formats, inconsistent structures, and a large number of missing values. Moreover, since risk values are subjective estimates, it is difficult to judge whether their estimates are accurate. Therefore, a manual modeling approach is needed, i.e., manually comparing the magnitude of the impact of various indicators on risk, using the Analytic Hierarchy Process to determine the weight of each indicator, and generating enterprise risk values. At the same time, since the weight definition in manual modeling involves subjective factors, machine learning modeling can address this issue. Thus, both methods are used for modeling, and the advantages and disadvantages of the two approaches are compared.
- Machine learning models perform well in handling binary (0,1) classification problems and can effectively determine whether an enterprise has risk, but they cannot obtain the specific risk value of the enterprise or compare relative risks between enterprises.
- Manual models can determine the importance of each dimension, identify specific risk points, and effectively conduct more detailed risk assessments of P2P enterprises, generating risk values. However, since the variable weights in manual modeling are subjectively compared and weighed, there is a certain degree of subjectivity, and their accuracy will be reduced.
Visualization Display
Website Architecture
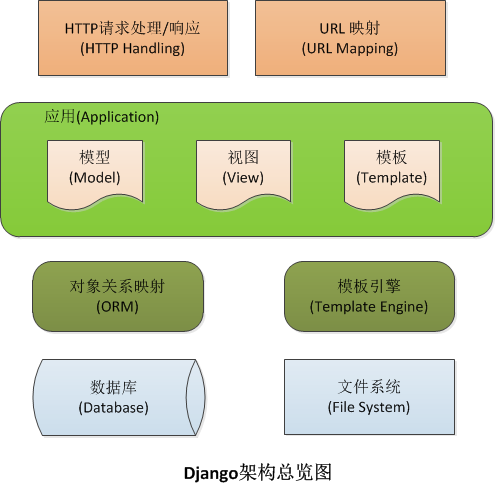
To facilitate querying the risk status of typical P2P platforms, our system implements a visualization display website that intuitively presents the risks existing in P2P enterprises through D3 visualization technology.
The backend Django server receives POST/AJAX requests sent by the frontend. After parsing the request, it distributes the request to the corresponding business processing module through a dispatch controller. The model layer sends data requests to the database through Django. Django automatically generates corresponding SQL statements based on the requests, applies to the corresponding one or more data databases for the required processing data, and finally returns the data to the model layer for processing. After the corresponding model obtains the relevant data, it brings the data into the corresponding model for calculation and processing, obtains the desired results, and returns the results in JSON format to the frontend client. The frontend parses the obtained JSON data through D3.js and presents the data in a visualized form.
Web Page Display
Website Homepage
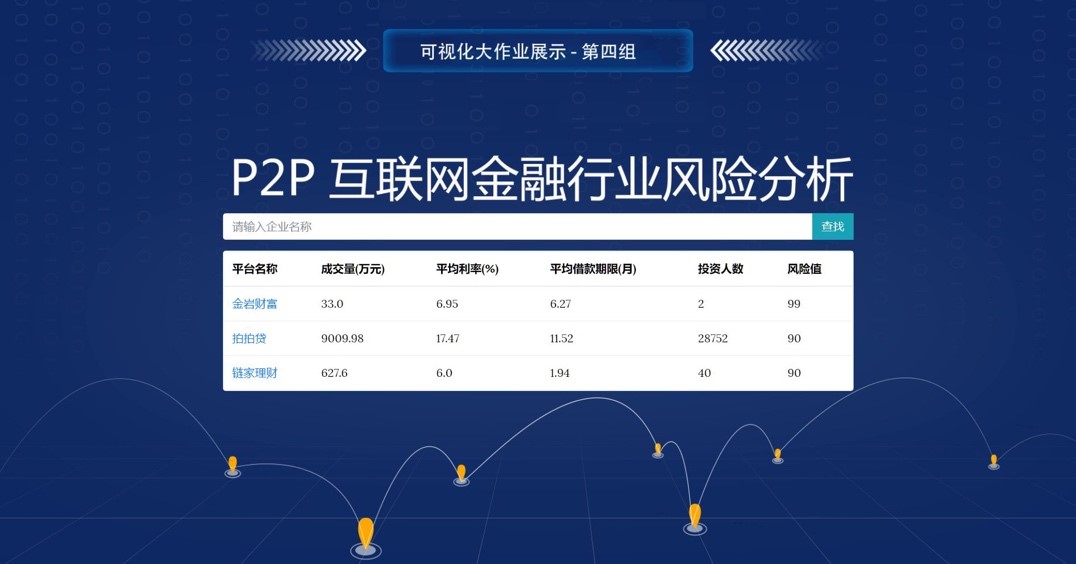
By default, it displays the top 3 P2P enterprises with the highest risk values, and the target enterprises can be found through search.
P2P Enterprise Regional Distribution Heatmap
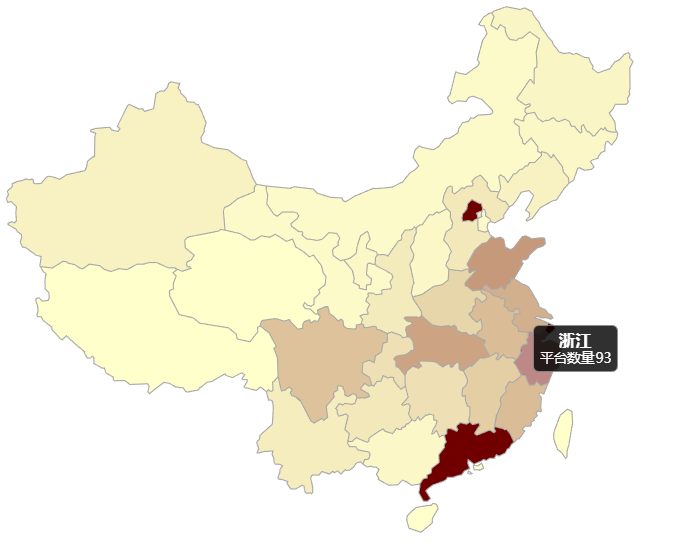
It can be intuitively observed that P2P enterprises are mainly concentrated in the Beijing, Shanghai, Guangdong, Jiangsu, and Zhejiang regions.
Overall Risk Analysis for an Enterprise
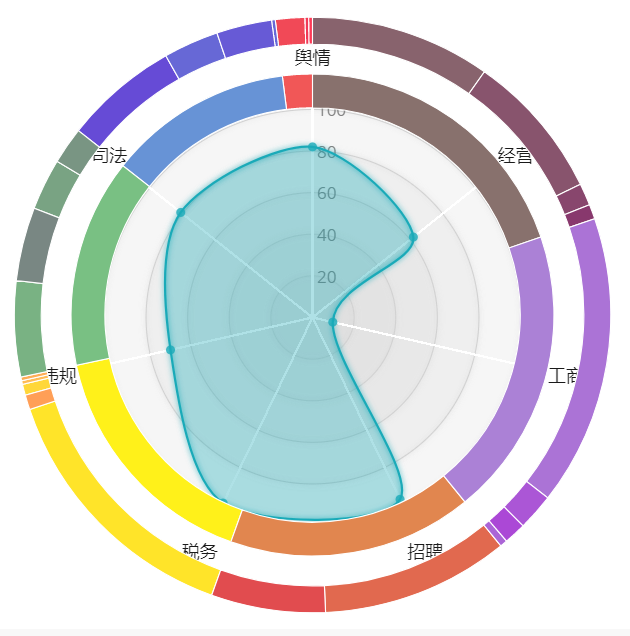
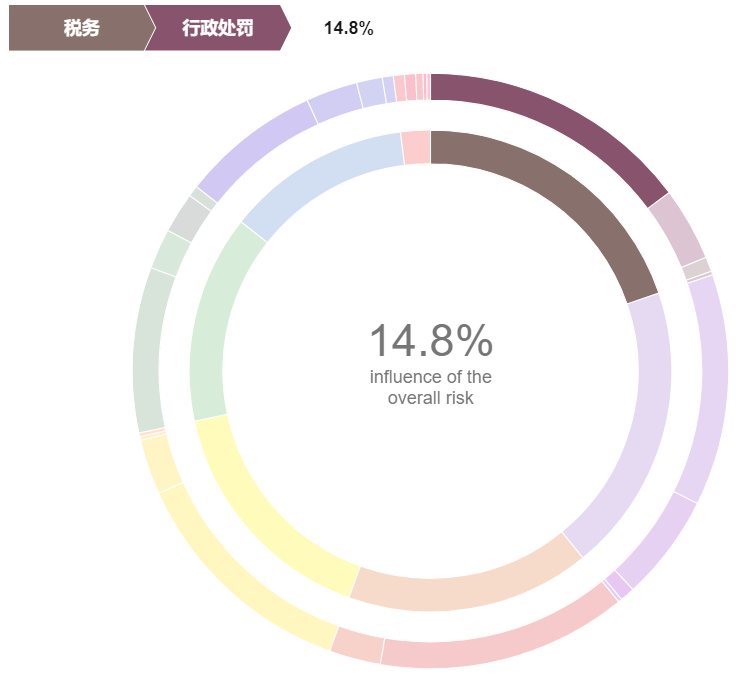
Through a combination of radar charts and sector charts, the risk values across 7 dimensions of an enterprise and the proportion of each dimension's influence on the overall risk value are intuitively displayed.
The main implementation idea of the code: the visibility property obtained through the div tag controls the display switching between the radar chart and the proportion values. Data is requested from the frontend via AJAX requests, and the backend returns it in JSON format.
Industry & Commerce Dimension Risk Overview for an Enterprise
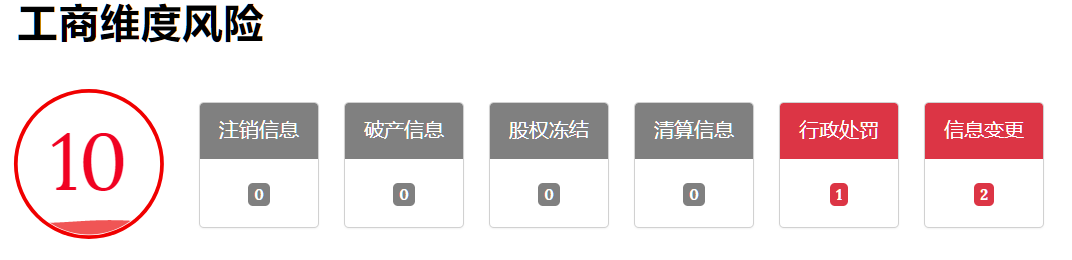
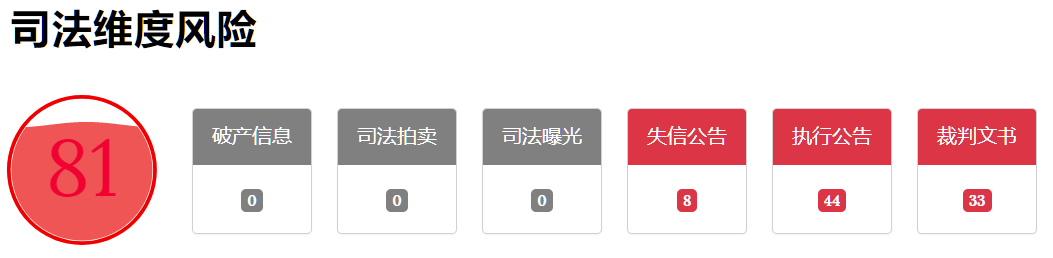
Each of the 7 different risk dimensions has its own risk value, representing the risk level in that domain, obtained from the backend via frontend GET requests. The circles representing the risk values are drawn using D3's Path, and animation effects are rendered using the transform translate.
Judicial Dimension Case Relationship Network for an Enterprise
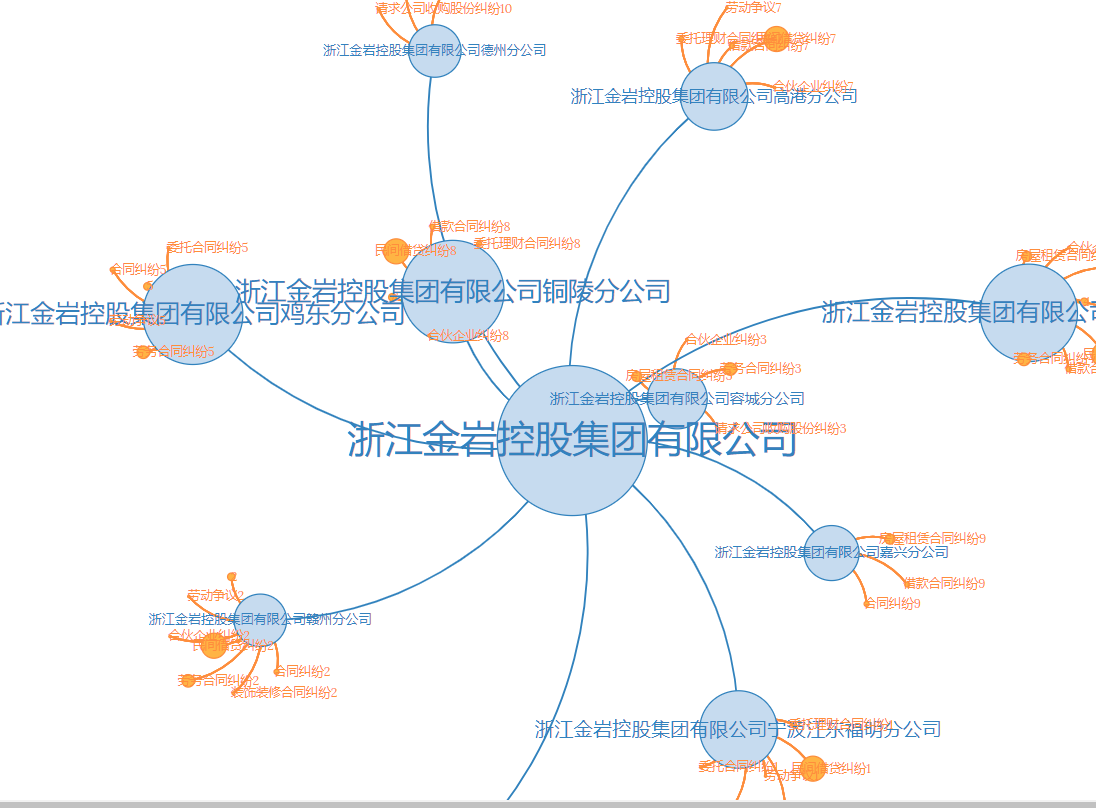
The judicial dimension case relationship network uses D3's force layout to represent the number and relationships of all legal cases involving the company and its subsidiaries in the judicial domain. Data is requested from the frontend via AJAX requests, and the backend returns it in JSON format.
Transaction Volume and Interest Rate Change Charts for an Enterprise
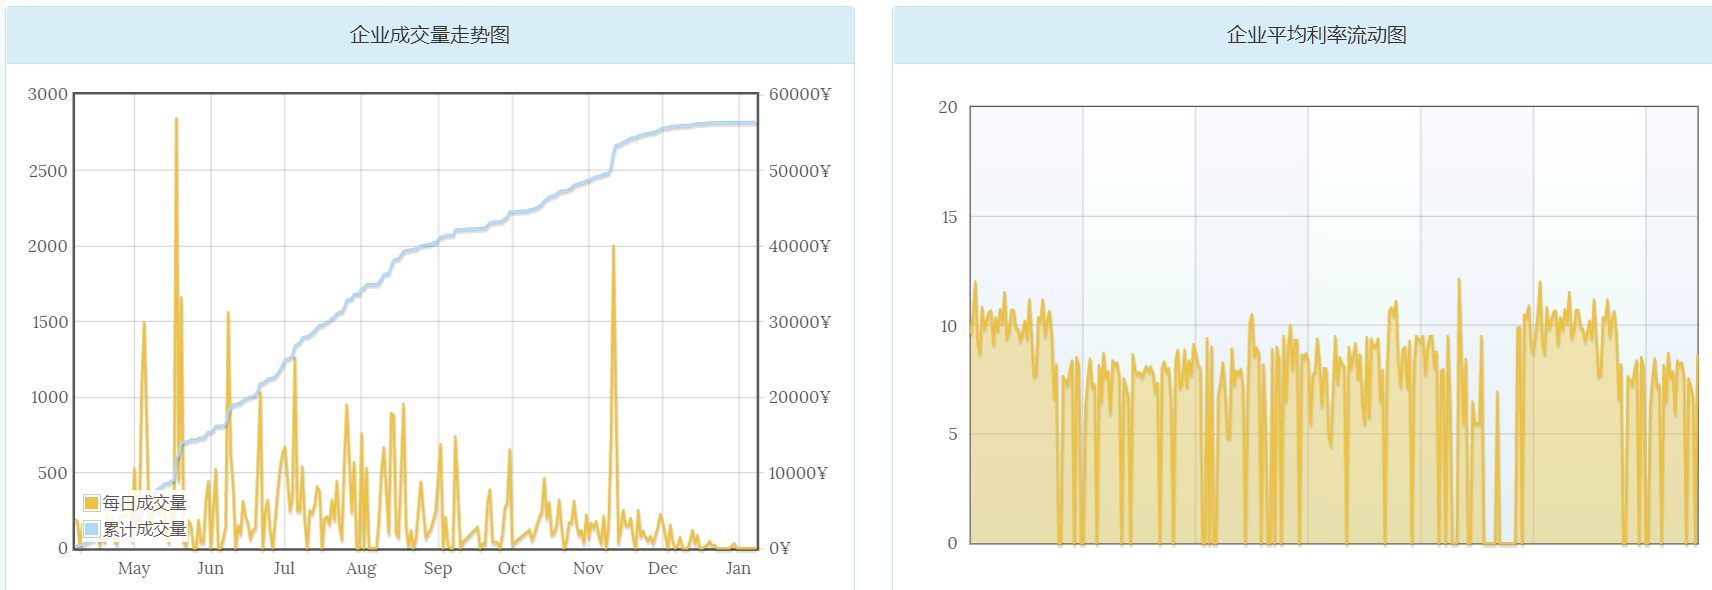
Bootstrap's flot-chart is used to plot the recent transaction volume trend chart of the enterprise and the dynamic change chart of the enterprise's average interest rate over time. Through the trend charts, we can intuitively observe that the enterprise's recent transaction volume has shown a significant decline, even approaching 0, indicating that there is a significant risk point for the enterprise in the recent period.
Through these two charts, the enterprise's recent business operations can be analyzed relatively intuitively. Data is requested from the frontend via AJAX requests, and the backend returns it in JSON format.
Word Cloud Display in the Public Opinion Dimension for an Enterprise

By crawling all public opinion information related to the enterprise from the web (data sourced from major news media), performing a simple word segmentation process on this public opinion information, a word cloud drawn based on public opinion keyword frequency can be obtained. The drawing of this word cloud is assisted by an open-source project of D3 — d3.layout.cloud.js. Data is requested from the frontend via AJAX requests, and the backend returns it in JSON format.
Recruitment Number Proportion Chart under the Recruitment Dimension for an Enterprise
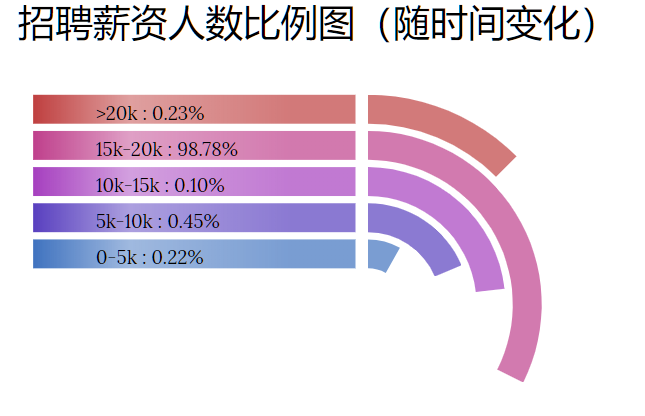
This is a modified version of a sector chart that can intuitively display the proportion of each type of recruitment in a particular recruitment event. The main feature of this chart is that it can conveniently show the distribution of each dimension in every recruitment event (this is an animated chart: new data is selected at set time intervals to redraw the chart). Data is requested from the frontend via AJAX requests, and the backend returns it in JSON format.
Recruitment Number Trend Chart and Recruitment Education Distribution Chart under the Recruitment Dimension for an Enterprise
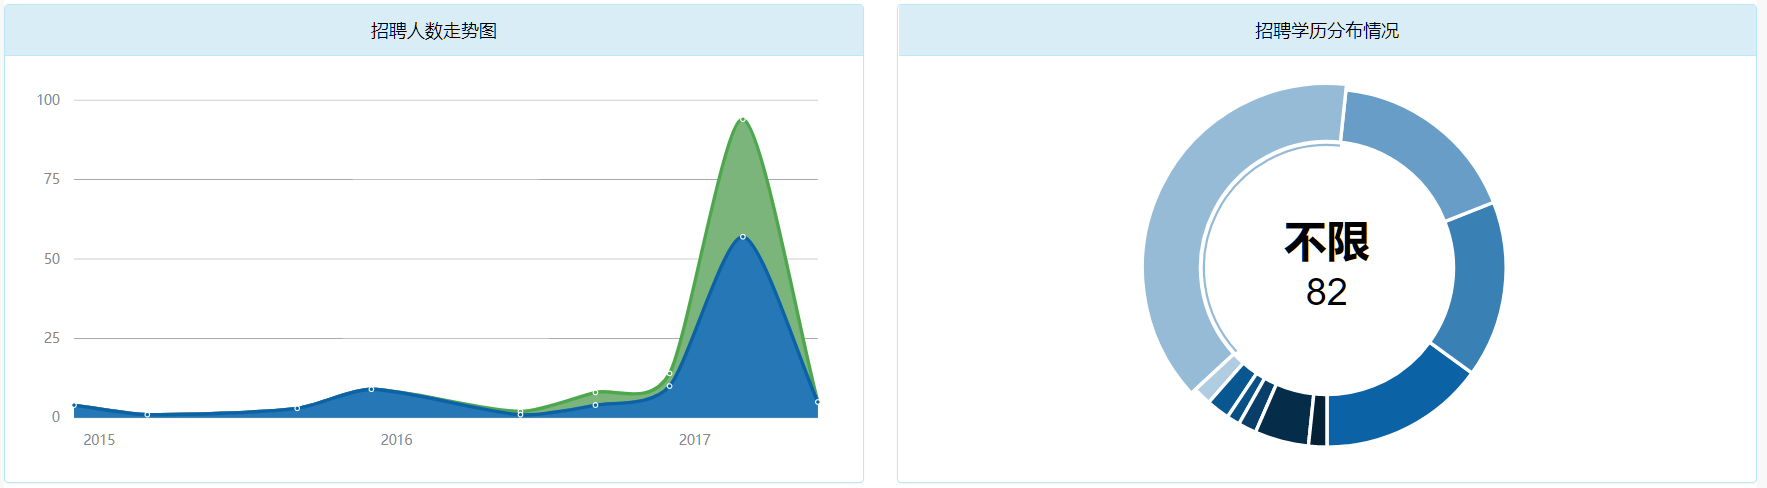
It can display the enterprise's recruitment situation. From the chart above, we can analyze that around mid-2017, the enterprise suddenly conducted large-scale recruitment activities, and according to the recruitment education distribution chart, the enterprise recruited a large number of people without educational qualifications during this period, which is a strong risk point. The drawing of this chart is assisted by Bootstrap's morris-area-chart and morris-donut-chart. Data is requested from the frontend via AJAX requests, and the backend returns it in JSON format.